Timing is everything in real estate. Finding areas poised for growth before prices surge can unlock long-term value for homeowners and investors alike. New Homes Alberta, a trusted resource in Canadian property markets, combines local expertise with data-driven strategies to help clients navigate these opportunities.
Early-stage neighborhoods often show specific markers of potential. Increased development activity, upgraded infrastructure, and rising community engagement frequently precede market shifts. Analyzing sales patterns and renovation permits can reveal where demand might outpace supply.
While these areas offer attractive entry points, balancing optimism with caution remains crucial. Factors like transportation upgrades or new commercial projects often signal growth, but thorough research into local trends separates promising bets from risky ventures. New Homes Alberta (403-305-9167) specializes in translating complex market data into actionable insights for clients.
Key Takeaways
- Market timing significantly impacts property value growth potential
- Local development projects often indicate future area desirability
- Historical price data helps forecast neighborhood trajectories
- Professional guidance reduces risks in emerging markets
- Infrastructure improvements frequently precede community growth
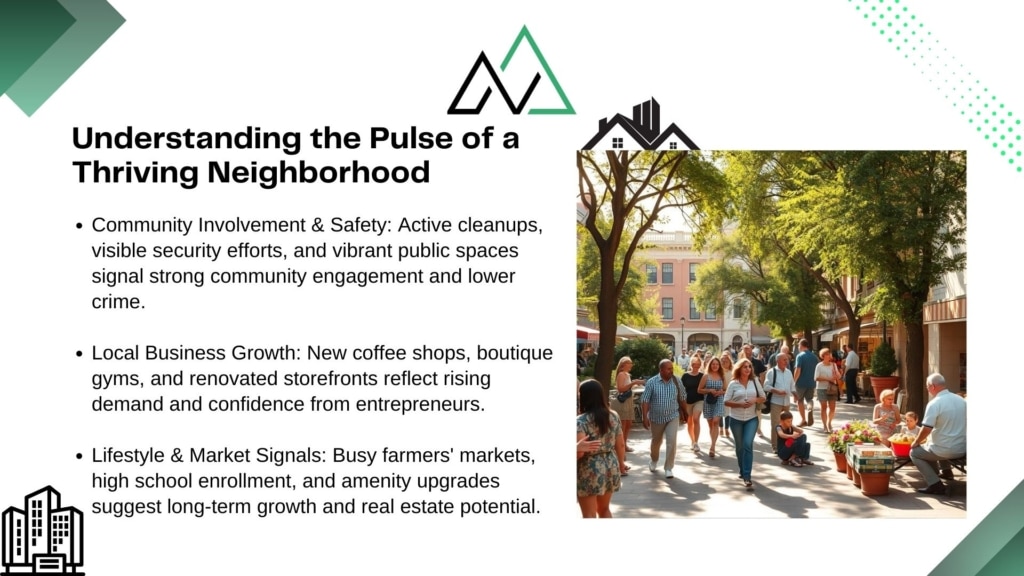
Understanding the Pulse of a Thriving Neighborhood
A neighborhood’s vitality often reveals itself through the daily rhythms of its residents. Active community boards, frequent local events, and well-maintained public spaces signal engaged residents invested in their surroundings. These factors create a foundation for stability and growth, particularly when paired with declining crime rates and rising school enrollment.

Local Community Engagement and Safety
Neighborhoods with organized cleanup initiatives or volunteer-led programs typically see safer streets. Areas reporting lower crime rates often correlate with visible foot traffic and active parent-teacher associations. Well-lit sidewalks, neighborhood watch signs, and updated playground equipment suggest residents prioritize shared spaces.
Spotting Trend Indicators in Local Businesses
Independent coffee shops, boutique fitness studios, and craft breweries often cluster in areas attracting young professionals. When multiple businesses refresh their storefronts within a year, it hints at growing market confidence. Consistent upgrades to amenities like bike racks or outdoor seating areas further demonstrate a community’s upward trajectory.
Tracking these patterns helps buyers spot locations where demand could outpace supply. Combining local crime statistics with observations of bustling farmers’ markets or packed library events provides a realistic picture of neighborhood potential. Data-driven insights paired with on-the-ground energy create a compelling case for long-term value.
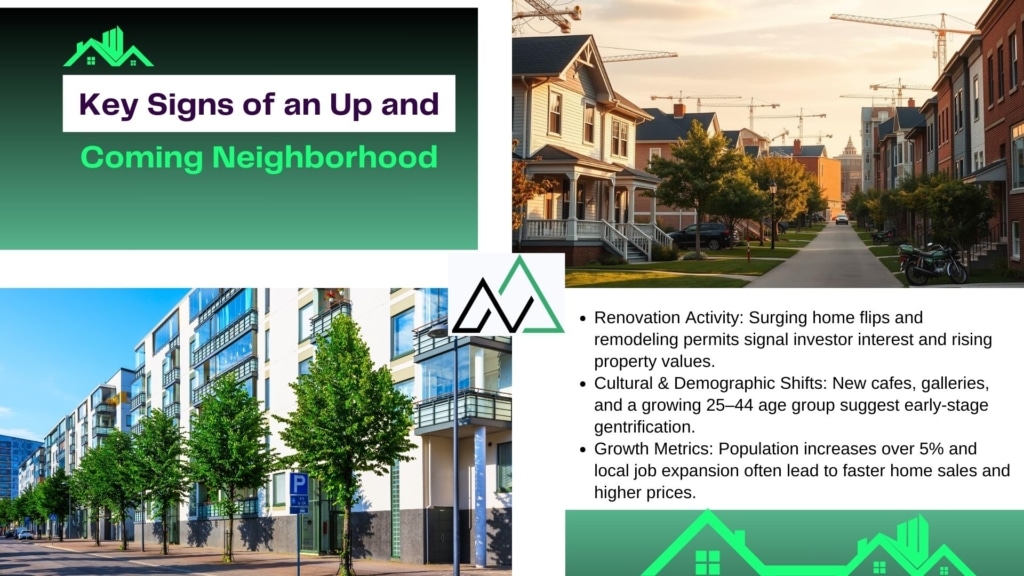
Key Signs of an Up-and-Coming Neighborhood
The transformation of a neighborhood often starts with subtle yet telling changes. Property upgrades, shifting demographics, and employment patterns combine to reveal areas primed for growth. Savvy investors track these markers to gauge long-term potential before prices reflect full momentum.

Property Renovation Trends and Home Flipping
Increased renovation permits and flipped homes signal rising interest. Areas with 20%+ year-over-year growth in remodeling projects often see property values climb faster than regional averages. Construction crews on multiple streets or updated exteriors suggest owners anticipate future demand.
| Aspect | Before Renovation | After Renovation | Impact |
|---|---|---|---|
| Average Home Prices | $320,000 | $410,000 | +28% |
| Days on Market | 45 days | 22 days | -51% |
| Buyer Interest | 3 views/week | 9 views/week | 3x increase |
Gentrification Indicators and Demographic Shifts
New cafes, art galleries, or co-working spaces often precede price jumps. When neighborhoods attract residents aged 25-44 at twice the city’s rate, it frequently correlates with estate value growth. Upgraded parks and transit stops further reflect municipal investment.
Monitoring Population Growth and Employment Patterns
Areas adding 5%+ residents annually typically outpace broader markets. Rising employment in tech or healthcare sectors nearby creates housing demand. Shorter days on market (DOM) for properties—below 30 days—often indicate competitive bidding environments.
Combining these quantitative trends with qualitative observations, like community gardens or murals, paints a complete picture. Early recognition of these patterns helps secure investments before peak growth phases.
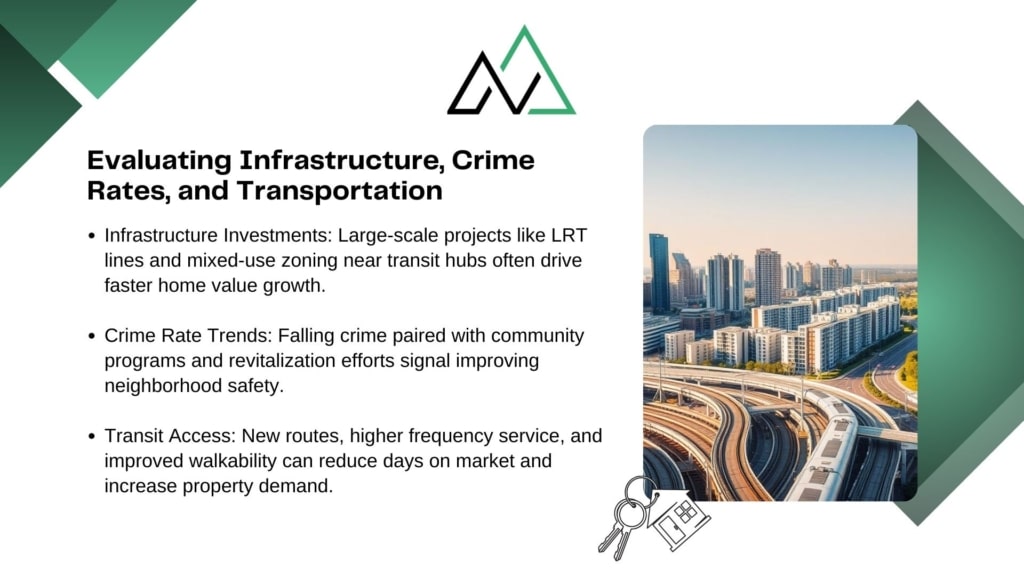
Evaluating Infrastructure, Crime Rates, and Transportation
Cities evolve through deliberate planning and community action. Strategic investments in public resources often reveal which areas merit closer attention from property seekers. Three factors consistently separate emerging locations from stagnant ones.

Assessing Infrastructure Upgrades and City Initiatives
Edmonton’s Blatchford development exemplifies how municipal projects drive change. This former airport site now features geothermal energy systems and pedestrian-focused design. Such initiatives typically correlate with 18-24% faster property value growth compared to surrounding areas.
Key indicators of serious commitment:
- Multi-year road improvement budgets exceeding $50M
- Mixed-use zoning approvals near transit hubs
- Heritage building restorations paired with modern amenities
| City Project | Investment | Days on Market Change |
|---|---|---|
| Calgary Green Line LRT | $5.6B | -34% (2021-2023) |
| Winnipeg Southwest Transitway | $467M | -28% (2020-2022) |
Tracking Crime Rates and Transit Access
Toronto’s Regent Park revitalization shows how safety and connectivity interact. After adding community policing and a streetcar extension, violent crime dropped 41% while property values rose 63% in seven years.
Effective evaluation combines:
- Police-reported crime statistics (yearly trends)
- Transit frequency improvements (15+ extra daily trips)
- Walk Score increases above neighborhood averages
Smart investors cross-reference infrastructure timelines with real estate data. Areas near upcoming transportation nodes often see demand outpace supply 6-12 months before project completion.
How to Identify Up and Coming Neighborhoods
Smart property decisions rely on understanding hidden patterns in local markets. Tracking key metrics helps spot locations where prices might rise before widespread attention arrives. Data-driven analysis separates fleeting trends from sustainable growth.
Utilizing Local Real Estate Data and Market Trends
Start by comparing average sale prices across 3-5 years. Areas showing 7%+ annual increases often signal rising demand. Pair this with days-on-market (DOM) data—neighborhoods where properties sell 30% faster than regional averages typically gain momentum.
Renovation permits and flipped homes matter too. One Calgary community saw 22% more renovation applications last year, followed by a 19% price jump. “Numbers don’t lie,” says a local analyst. “When builders and buyers both invest, growth usually follows.”
Insights from New Homes Alberta
School upgrades and new recreation centers often predict desirability spikes. Edmonton’s Griesbach area added two schools and a library between 2018-2022, correlating with 34% home value growth. Always cross-reference municipal plans with real-time sales data.
- Track zoning changes near transit routes
- Monitor commercial vacancy rates below 8%
- Note increasing foot traffic at local businesses
Early investors in Winnipeg’s Exchange District capitalized on these signs, securing properties before prices doubled. For personalized strategies, connect with New Homes Alberta’s specialists at (403) 305-9167. Their team transforms complex data into clear opportunities.
Investment Insights for First-Time Homebuyers and Investors
Navigating real estate requires balancing data with local insights. First-time buyers and seasoned investors alike benefit from tracking metrics that reveal sustainable growth patterns. Focused strategies reduce risks while maximizing returns in evolving markets.
Leveraging Market Trends for Strategic Investments
Current data shows Calgary’s Beltline district outperformed city averages with 14% annual price growth. This surge followed a 40% increase in new restaurants and retail openings since 2021. Investors targeting similar areas often see 20-30% faster equity growth than traditional markets.
| Strategy | Average Return (3 Years) | Key Focus |
|---|---|---|
| Transit-Adjacent Properties | +22% | Walkability scores >80 |
| Mixed-Use Developments | +27% | Commercial-residential balance |
| Renovation-Focused | +19% | Permit approval rates |
Practical Advice from Trusted Canadian Real Estate Experts
“Successful investors cross-reference municipal plans with business licenses,” notes Vancouver analyst Claire Tremblay. When a neighborhood issues 15+ new permits for cafes or co-working spaces annually, property demand usually follows.
Key tactics from recent Winnipeg success stories:
- Track employment hubs: Areas near tech parks saw 18% faster sales
- Monitor days on market: Below 25 days signals competitive bidding
- Prioritize walkable zones: Properties near shops sell 31% faster
Ottawa’s Hintonburg district demonstrates this approach. After a community center expansion and transit upgrades, home values rose 63% in five years. Pairing infrastructure timelines with business growth patterns creates actionable roadmaps for buyers.
Key Takeaways for Identifying Emerging Neighborhoods
Savvy real estate decisions begin with recognizing patterns that others overlook. Rising renovation permits, thriving local businesses, and improved transportation networks often mark areas primed for growth. Data from Calgary’s Beltline district shows properties near upgraded amenities sell 31% faster than those without.
Successful investors balance market trends with on-the-ground observations. They track school upgrades, declining crime rates, and new restaurants—factors that signal resident confidence. Edmonton’s Griesbach area saw 34% value growth after adding community-focused infrastructure, proving this approach works.
Timing remains critical. Early investments in transit-adjacent properties or mixed-use developments often yield 20-27% returns within three years. Partnering with experts like New Homes Alberta helps navigate complex data, ensuring choices align with municipal plans and buyer demand.
By focusing on verifiable trends—not hype—you build lasting value. Connect with New Homes Alberta at (403) 305-9167 to transform neighborhood insights into strategic action. Their team turns market signals into your advantage, one informed decision at a time.
FAQ
What indicators suggest a neighborhood is thriving?
Look for increased community engagement through local events, new businesses like cafes or boutique shops, and safety improvements like neighborhood watch programs. Proximity to schools, parks, and employment hubs often signals sustained growth.
How does property renovation activity reflect neighborhood potential?
Clusters of renovated homes or flipped properties often attract buyers seeking modern amenities. Check municipal permits for remodeling projects or commercial developments like Calgary’s East Village revitalization, which boosted property values.
Why are infrastructure upgrades critical for growth?
Projects like Edmonton’s Valley Line LRT expansion improve accessibility, raising demand. Updated roads, public transit, and utilities also reduce crime rates by increasing foot traffic and community visibility.
How do market trends help identify emerging areas?
Track rising median prices, shorter days on market, and low inventory in platforms like CREB®. For example, Edmonton’s Glenora saw a 12% price surge after new schools opened, reflecting buyer confidence.
What should investors prioritize in up-and-coming areas?
Focus on neighborhoods near transit corridors or employment centers like Amazon’s Calgary hub. Analyze rental demand, mixed-use zoning changes, and population growth—key factors for long-term appreciation.
How does New Homes Alberta assist buyers?
Our team provides hyperlocal insights on Calgary and Edmonton trends, including pre-construction opportunities. Call (403) 305-9167 for data-driven strategies tailored to your investment goals.


